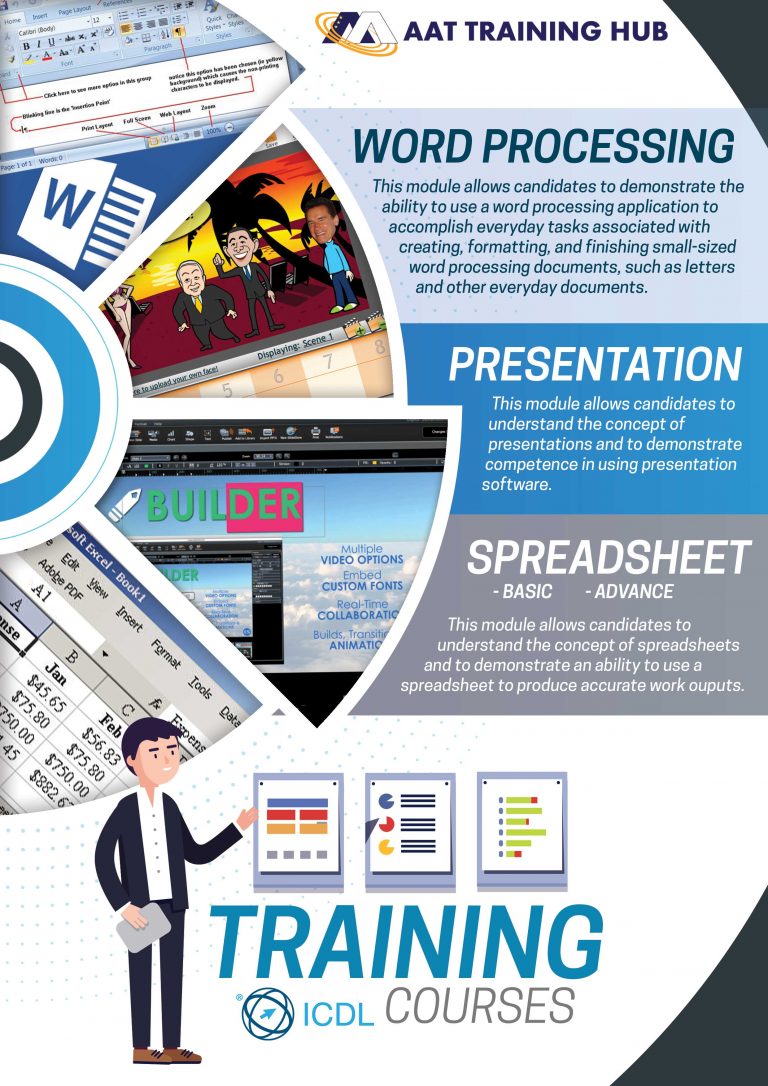
This Excel course (ICDL Spreadsheets) module covers the main concepts and skills needed to use spreadsheets, such as tasks associated with developing, formatting, modifying, and using a spreadsheet.
Organising and analysing data using a spreadsheet application produces useful insights for all types of organisation. In addition to using standard formulas and functions, this module covers visualisation of data through creating and formatting graphs or charts.
The analysis of numerical data is an important activity in a wide range of job roles. Accountants, project managers, sales executives, engineers – and many more – rely
on spreadsheets to carry out crucial calculations.
Duration: 16 hours
Fees: $400 (before GST)
Funding: pending
What you will learn:
In this Excel course, our candidates will be able to use a spreadsheet application to create and work with spreadsheets.
After passing this module, candidates will be confident entering, moving, editing, and deleting data, as well as performing other common spreadsheet tasks for effective business operations
They will be able to:
Why certify with ICDL?

AAT Training Hub Pte Ltd offers the following courses in Singapore:
Office Skills:
Programming and Design Skills:


Attending a Microsoft Excel course is a wise decision for anyone looking to enhance their data management and analytical skills. In today’s data-driven world, the ability to work with and analyze data efficiently is a fundamental requirement across nearly every industry. Microsoft Excel, with its extensive array of features and functionalities, is one of the most widely used software tools for organizing, manipulating, and visualizing data. Whether you’re a beginner or someone already familiar with basic Excel operations, enrolling in an Excel course can unlock new levels of proficiency, enabling you to perform tasks with greater accuracy and efficiency.
One of the primary reasons to attend an Excel course is its versatility across various industries. Excel is not limited to accounting or financial analysis, although it is indispensable in those fields. It is also widely used in marketing, sales, human resources, project management, logistics, and even creative industries like design and content creation. For example, in marketing, Excel can help analyze campaign performance by tracking metrics, performing keyword analysis, and managing large data sets related to customer interactions. In sales, Excel allows users to track sales performance, calculate commissions, and forecast trends. Human resource professionals use Excel for managing payroll, tracking employee performance, and even workforce planning. The ability to leverage Excel effectively allows professionals across these industries to make informed, data-driven decisions that benefit their organization.
Another significant advantage of attending an Excel course is the knowledge gained in automating repetitive tasks. One of Excel’s most powerful capabilities is its ability to automate calculations and processes using built-in formulas, functions, and tools like macros. Formulas such as SUM, VLOOKUP, and IF enable users to automate complex calculations, reducing the potential for human error and saving a considerable amount of time. Learning how to use these functions properly during an Excel course can increase your efficiency, enabling you to handle larger data sets more effectively and generate insights much faster.
Macros, another advanced feature of Excel, allow for the automation of multi-step processes that would otherwise take considerable time if done manually. For instance, if you regularly perform the same formatting or data cleaning tasks across multiple worksheets, a macro can automate those steps with a single click. A well-structured Excel course will teach you not only how to record macros but also how to write simple code in Visual Basic for Applications (VBA), which extends Excel’s functionality and allows for more complex automation tasks. This skill is invaluable in any role that requires repetitive data processing or reporting.
Data management is a critical function in any business or professional setting, and Excel is an indispensable tool for organizing large volumes of data. Whether you are handling lists of clients, managing inventory, or working with project schedules, an Excel course will equip you with the skills to structure, clean, and sort data efficiently. Excel’s built-in functions for filtering, sorting, and conditional formatting enable users to quickly locate and organize data based on specific criteria. This allows for better data visualization and, ultimately, better decision-making.
Additionally, Excel’s analytical tools, such as pivot tables and pivot charts, are invaluable for summarizing and analyzing data. These tools allow users to extract meaningful insights from large data sets without having to rely on external software. By mastering these features in an Excel course, you will be able to generate dynamic reports that provide a clear overview of business performance or trends. Pivot tables, in particular, allow for the aggregation of data from different categories, which is incredibly useful for comparing and analyzing data at a granular level. Excel’s charting tools also offer an intuitive way to visualize trends, helping to make complex data more digestible for stakeholders or team members.
In addition to being a tool for calculations and data organization, Excel is also a powerful platform for data visualization. Charts, graphs, and dashboards can help communicate data trends and insights more effectively than rows and columns of numbers alone. A comprehensive Excel course will teach you how to create a variety of charts (bar, line, pie, etc.), format them professionally, and customize them to suit your needs. Moreover, advanced users can learn how to create interactive dashboards that dynamically update based on changing data inputs. This can be particularly valuable for managers, analysts, or any professionals tasked with presenting data to clients or executives.
Beyond basic charting, an Excel course can also provide instruction on more sophisticated visualization techniques, such as conditional formatting and sparklines. Conditional formatting allows users to apply visual cues (like color scales or data bars) to cells based on the data they contain, making it easier to spot trends or anomalies at a glance. Sparklines are small, in-cell charts that offer a compact way to visualize trends over time, perfect for dashboards or performance tracking. By mastering these visualization techniques, you will be better equipped to create compelling reports that help drive decision-making.
Excel is more than just a software tool; it is also an environment that fosters problem-solving and critical thinking. In an Excel course, you will be presented with various business scenarios that require you to use formulas, functions, and logic to arrive at solutions. For example, learning how to use the IF statement to create conditional logic allows you to handle decision-making within spreadsheets. You might use it to automatically flag overdue payments, highlight underperforming sales regions, or trigger alerts when inventory levels drop below a certain threshold. These problem-solving exercises in Excel translate directly to real-world scenarios, sharpening your analytical thinking and improving your ability to tackle complex challenges at work.
Excel also plays a critical role in collaboration. Today’s Excel environments allow multiple users to collaborate in real time, especially with cloud-based tools like Excel for Microsoft 365. This makes it easier for teams to work together on projects, share insights, and make collective decisions based on shared data. An Excel course will introduce you to the best practices for sharing workbooks, tracking changes, and securing sensitive data with features like password protection and access controls. Understanding these aspects of Excel enhances your ability to collaborate effectively within teams, making your contributions more visible and valuable.
Mastering Excel not only makes you more efficient and effective in your current role but also opens doors to new career opportunities. Many job descriptions across industries list Excel proficiency as a critical requirement. By completing an Excel course and gaining certification, you demonstrate a high level of competency to employers, which can lead to career advancements or new job prospects. Moreover, advanced Excel skills, particularly in areas such as data analysis, financial modeling, and automation, are often associated with higher-paying roles in management, finance, data science, and other fields.